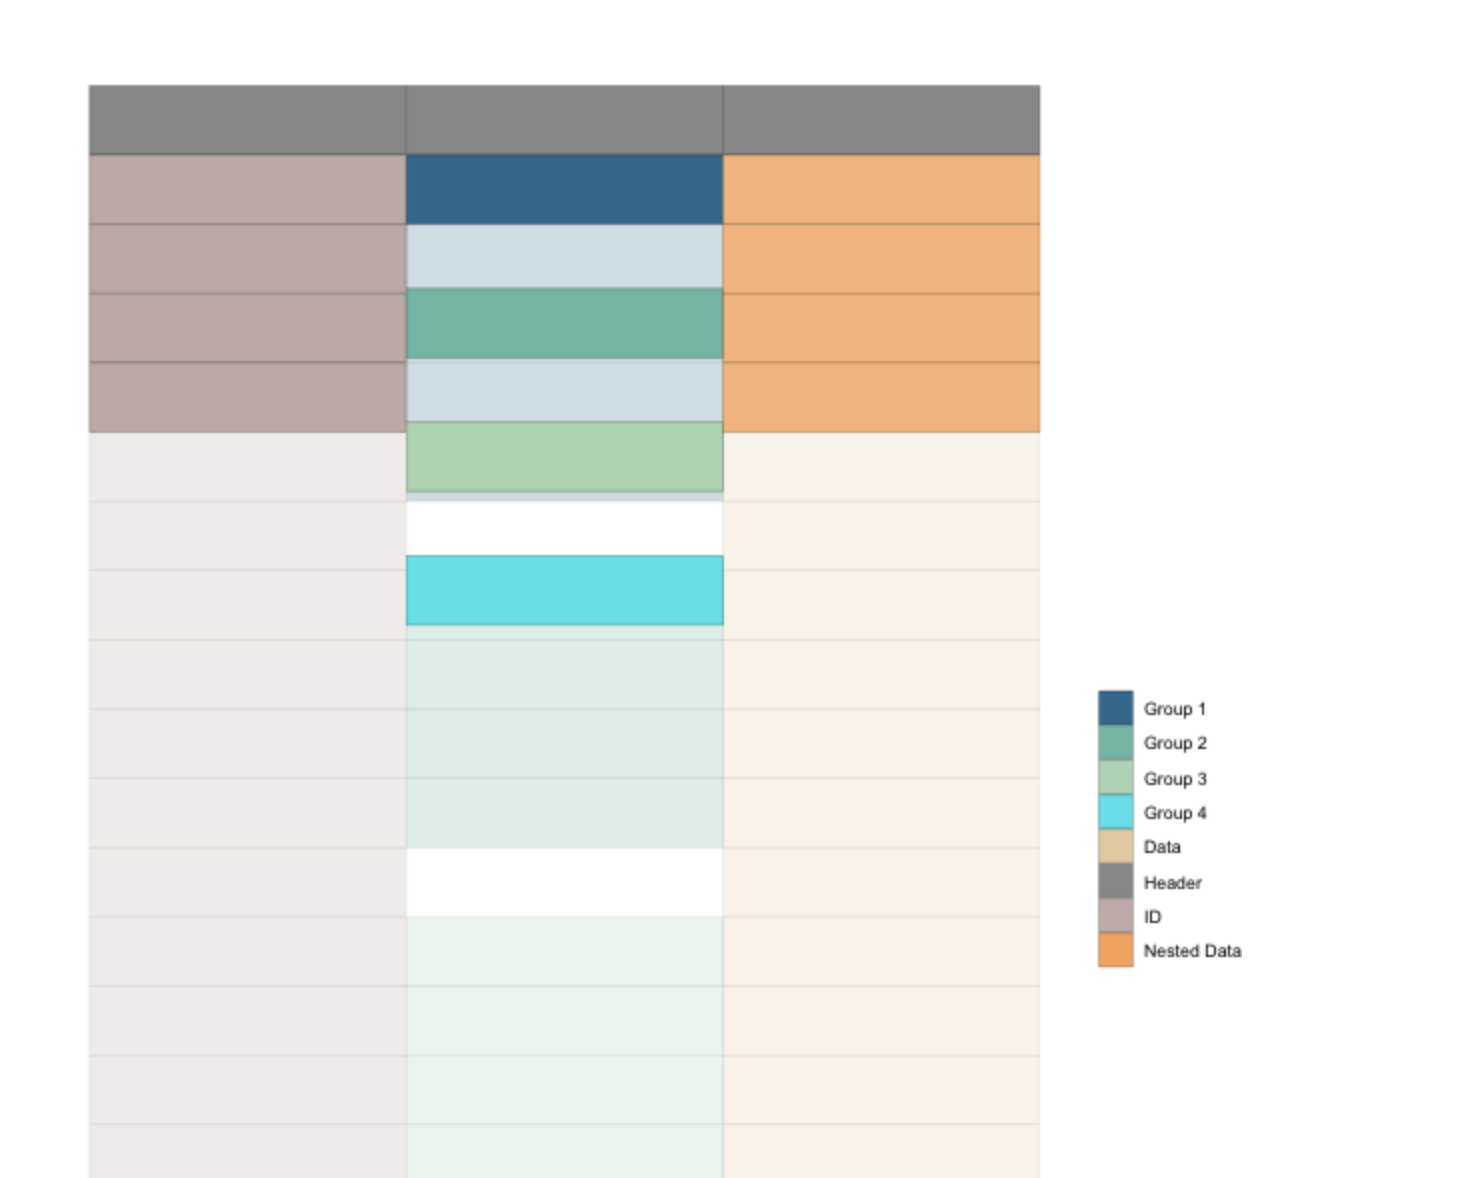
In our previous series on Animating Data Transformations, we showed you how to use gganimate to construct an animation which illustrates the process of going between tall and wide representations of data. Today, we will show the same procedure for constructing an animation of the unnest() function.
The unnest() function takes a tibble containing a list column and converts it to a tibble such that each element in the list comprises a single row. Think of it as “unpacking” the list column into a more standard vector column in R.
We will create a toy dataset using the sleep data, and ensure that it contains a list column:
library(tidyverse)
library(gganimate)

sleep_data <- sleep %>%
    mutate(group = rep(1:4, each = 5),
           ID = rep(1:4, each = 5)) %>%
    select(id = ID, group, data = extra)

sleep_data
# A tibble: 20 x 3
      id group  data
   <int> <int> <dbl>
 1     1     1   0.7
 2     1     1  -1.6
 3     1     1  -0.2
 4     1     1  -1.2
 5     1     1  -0.1
...
You can see that we have a 20 row by 3 column tibble in R. Next, we perform the following routine in order to nest the data column into a new nesteddata column:
sleep_nested <- sleep_data %>%
    group_by(group) %>%
    summarise(id = id[1], nesteddata = list(data))

sleep_nested
# A tibble: 4 x 3
  group    id nesteddata
  <int> <int> <list>
1     1     1 <dbl [5]>
2     2     2 <dbl [5]>
3     3     3 <dbl [5]>
4     4     4 <dbl [5]>
Next, we perform a similar routine to the previous blog and combine the two datasets into one dataset which will be used to build the animation:
longDat <- function(x) {
    names(x) %>%
        rbind(x) %>%
        setNames(seq_len(ncol(x))) %>%
        mutate(row = row_number()) %>%
        tidyr::gather(column, value, -row) %>%
        mutate(column = as.integer(column)) %>%
        ungroup() %>%
        arrange(column, row)
}

long_tables <- map(list(sleep_nested, sleep_data), longDat)

nested_table <- long_tables[[1]] %>%
    mutate(tstep = "a",
           value = sapply(value, paste, collapse = ", "))

unnested_table <- long_tables[[2]] %>%
    mutate(tstep = "b")

both_tables <- bind_rows(nested_table, unnested_table)

both_tables$celltype[both_tables$column == 1] <- c("header", rep("id", 4), "header", rep("id", 20))
both_tables$celltype[both_tables$column == 2] <- c("header", rep(1:4, each = 1), "header", rep(1:4, each = 5))
both_tables$celltype[both_tables$column == 3] <- c("header", rep("nesteddata", 4), "header", rep("data", 20))

both_tables
# A tibble: 78 x 5
     row column value tstep celltype
   <int>  <int> <chr> <chr> <chr>
 1     1      1 group a     header
 2     2      1 1     a     id
 3     3      1 2     a     id
 4     4      1 3     a     id
 5     5      1 4     a     id
 6     1      2 id    a     header
 7     2      2 1     a     1
 8     3      2 2     a     2
 9     4      2 3     a     3
10     5      2 4     a     4
# … with 68 more rows
From this, we can produce static versions of the two images which will form the basis for the animation:
base_plot <- ggplot(both_tables, aes(column, -row, fill = celltype)) +
    geom_tile(color = "black") +
    theme_void() +
    scale_fill_manual(values = c("#247ba0","#70c1b3","#b2dbbf","turquoise2", "#ead2ac", "grey60", "mistyrose3", "#ffae63"),
                      name = "",
                      labels = c("Group 1", "Group 2", "Group 3", "Group 4", "Data", "Header", "ID", "Nested Data"))

base_plot +
    facet_wrap(~tstep)

Finally, we use gganimate to build the final animation!
p1 <- base_plot +
    transition_states(
        states            = tstep,
        transition_length = 1,
        state_length      = 1
    ) +
    enter_fade() +
    exit_fade() +
    ease_aes('sine-in-out')

p1_animate <- animate(p1, height = 800, width = 600, fps = 20, duration = 10)
anim_save("unnest_animate.gif")

And there you have it! We hope this was helpful both in learning how to produce data transformation animations, and in terms of learning the unnest() operation itself. If you have any requests for more data transformation animations, please let us know, and be on the look out for future posts in this series!
