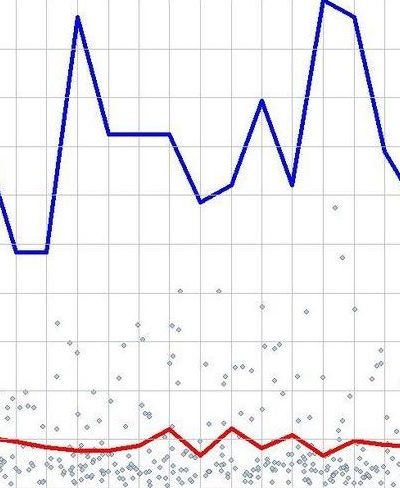
Prior to the era of reproducible research, it was quite common for published graphs, charts, and other figures to be released solely as static images such and PNGs or JPEGs. Often times this is not
Blog
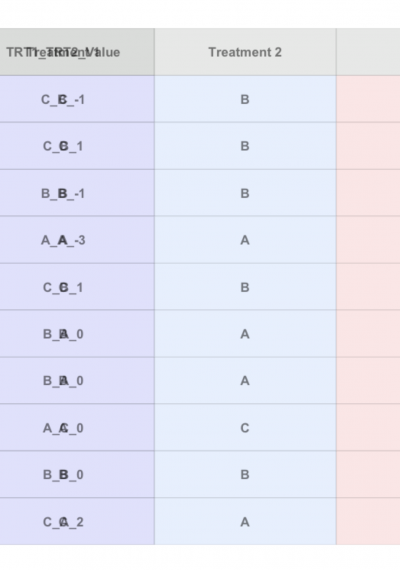
We recently have published two blogs on animating data transformations. The first, Animating Data Transformations, illustrated the spread() and gather() functions for going between wide and tall representations of data. The second, Animating
In our previous series on Animating Data Transformations, we showed you how to use gganimate to construct an animation which illustrates the process of going between tall and wide representations of data. Today, we
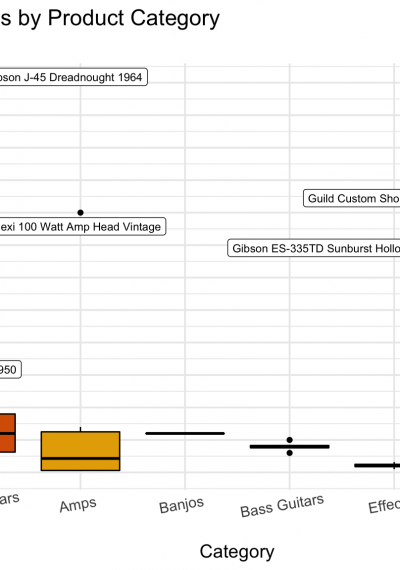
Our Twitter Profile was recently followed by an account belonging to GuitarsUnited. As we are always looking for new opportunities to analyze data and produce visualizations
A common statistical procedure is to convert a tall dataset into a wide one, or visa versa. A tall, or “tidy” format, meets the following criteria (See https://cran.r-project.org/web/packages/tidyr/vignettes/tidy-data.html for more information):
- Each
Summary:
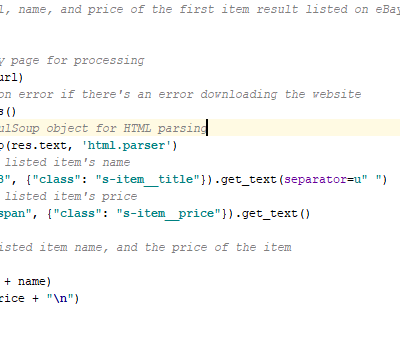
This blog post explains how to make a simple demo web scraping program in Python using Beautiful Soup 4. The program searches
Cross-posted with permission from Omni Analytics Innovative Technologies Initiative (OAITI)
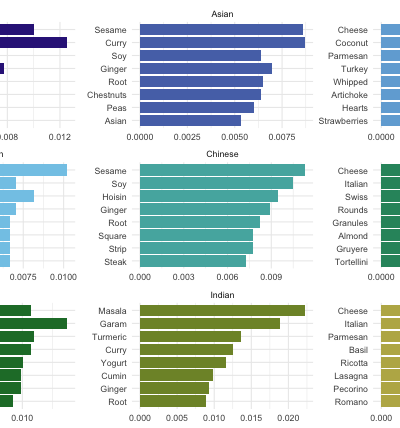
Certain ingredients are often staples of particular world cuisines. The use of hard cheeses in Italian cooking, and the use of masalas
2017 was a year of major accomplishments for our team at Omni Analytics Group. We wanted to briefly recap some of these accomplishments, and provide a little sneak peak of some of our company objectives
Welcome, welcome future Omniacs! This blog post is a simple stub, a placeholder if you will, for the first official post. We intend to have interesting content across the full spectrum of data


Comments are closed.